tynbl.github.io
交叉验证
import numpy as np
import matplotlib.pyplot as plt
import pandas as pd
import seaborn as sns
from sklearn.model_selection import train_test_split

# 用于在jupyter中进行绘图
%matplotlib inline
水果识别
1. 数据加载
# 加载数据集
fruits_df = pd.read_table('fruit_data_with_colors.txt')
fruits_df.head()
| fruit_label | fruit_name | fruit_subtype | mass | width | height | color_score | |
|---|---|---|---|---|---|---|---|
| 0 | 1 | apple | granny_smith | 192 | 8.4 | 7.3 | 0.55 |
| 1 | 1 | apple | granny_smith | 180 | 8.0 | 6.8 | 0.59 |
| 2 | 1 | apple | granny_smith | 176 | 7.4 | 7.2 | 0.60 |
| 3 | 2 | mandarin | mandarin | 86 | 6.2 | 4.7 | 0.80 |
| 4 | 2 | mandarin | mandarin | 84 | 6.0 | 4.6 | 0.79 |
print('样本个数:', len(fruits_df))
样本个数: 59
# 创建目标标签和名称的字典
fruit_name_dict = dict(zip(fruits_df['fruit_label'], fruits_df['fruit_name']))
print(fruit_name_dict)
{1: 'apple', 2: 'mandarin', 3: 'orange', 4: 'lemon'}
# 划分数据集
X = fruits_df[['mass', 'width', 'height', 'color_score']]
y = fruits_df['fruit_label']

X_train, X_test, y_train, y_test = train_test_split(X, y, test_size=1/4, random_state=0)
print('数据集样本数:{},训练集样本数:{},测试集样本数:{}'.format(len(X), len(X_train), len(X_test)))
数据集样本数:59,训练集样本数:44,测试集样本数:15
2. 特征归一化
from sklearn.preprocessing import MinMaxScaler

scaler = MinMaxScaler()
X_train_scaled = scaler.fit_transform(X_train)
X_test_scaled = scaler.transform(X_test)

for i in range(4):
    print('归一化前,训练数据第{}维特征最大值:{:.3f},最小值:{:.3f}'.format(i + 1,
                                           X_train.iloc[:, i].max(),
                                           X_train.iloc[:, i].min()))
    print('归一化后,训练数据第{}维特征最大值:{:.3f},最小值:{:.3f}'.format(i + 1,
                                           X_train_scaled[:, i].max(),
                                           X_train_scaled[:, i].min()))
    print()
归一化前,训练数据第1维特征最大值:356.000,最小值:76.000
归一化后,训练数据第1维特征最大值:1.000,最小值:0.000

归一化前,训练数据第2维特征最大值:9.200,最小值:5.800
归一化后,训练数据第2维特征最大值:1.000,最小值:0.000

归一化前,训练数据第3维特征最大值:10.500,最小值:4.000
归一化后,训练数据第3维特征最大值:1.000,最小值:0.000

归一化前,训练数据第4维特征最大值:0.920,最小值:0.550
归一化后,训练数据第4维特征最大值:1.000,最小值:0.000
3. 交叉验证
3.1 单一超参数
from sklearn.neighbors import KNeighborsClassifier
from sklearn.model_selection import cross_val_score

k_range = [5, 10, 15, 20]
cv_scores = []
for k in k_range:
    knn = KNeighborsClassifier(n_neighbors=k)
    scores = cross_val_score(knn, X_train_scaled, y_train, cv=3)
    cv_score = np.mean(scores)
    print('k={},验证集上的准确率={:.3f}'.format(k, cv_score))
    cv_scores.append(cv_score)
k=5,验证集上的准确率=0.845
k=10,验证集上的准确率=0.495
k=15,验证集上的准确率=0.521
k=20,验证集上的准确率=0.546
best_k = k_range[np.argmax(cv_scores)]
best_knn = KNeighborsClassifier(n_neighbors=best_k)
best_knn.fit(X_train_scaled, y_train)
print('测试集准确率:', best_knn.score(X_test_scaled, y_test))
测试集准确率: 1.0
# 调用  validation_curve 绘制超参数对训练集和验证集的影响
from sklearn.model_selection import validation_curve
from sklearn.svm import SVC
c_range = [1e-3, 1e-2, 0.1, 1, 10, 100, 1000, 10000]
train_scores, test_scores = validation_curve(SVC(), X_train_scaled, y_train,
                                             param_name='C', param_range=c_range,
                                             cv=3, scoring='accuracy')
train_scores_mean = np.mean(train_scores, axis=1)
train_scores_std = np.std(train_scores, axis=1)
test_scores_mean = np.mean(test_scores, axis=1)
test_scores_std = np.std(test_scores, axis=1)

plt.figure(figsize=(10, 8))
plt.title('Validation Curve with SVM')
plt.xlabel('C')
plt.ylabel('Score')
plt.ylim(0.0, 1.1)
lw = 2
plt.semilogx(c_range, train_scores_mean, label="Training score",
             color="darkorange", lw=lw)
plt.fill_between(c_range, train_scores_mean - train_scores_std,
                 train_scores_mean + train_scores_std, alpha=0.2,
                 color="darkorange", lw=lw)
plt.semilogx(c_range, test_scores_mean, label="Cross-validation score",
             color="navy", lw=lw)
plt.fill_between(c_range, test_scores_mean - test_scores_std,
                 test_scores_mean + test_scores_std, alpha=0.2,
                 color="navy", lw=lw)
plt.legend(loc="best")
plt.show()

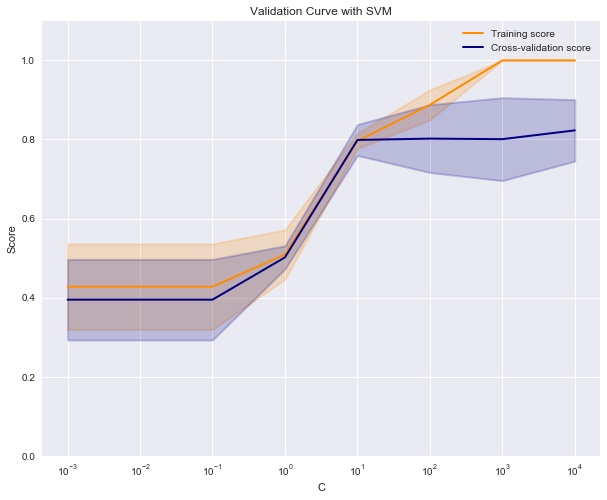
# 从上图可知对SVM,C=10, 100为最优参数
svm_model = SVC(C=100)
svm_model.fit(X_train_scaled, y_train)
print(svm_model.score(X_test_scaled, y_test))
0.866666666667
3.2 多个超参数
from sklearn.model_selection import GridSearchCV
from sklearn.tree import DecisionTreeClassifier

parameters = {'max_depth':[3, 5, 7, 9], 'min_samples_leaf': [1, 2, 3, 4]}
clf = GridSearchCV(DecisionTreeClassifier(), parameters, cv=3, scoring='accuracy')
clf.fit(X_train, y_train)
GridSearchCV(cv=3, error_score='raise',
       estimator=DecisionTreeClassifier(class_weight=None, criterion='gini', max_depth=None,
            max_features=None, max_leaf_nodes=None,
            min_impurity_decrease=0.0, min_impurity_split=None,
            min_samples_leaf=1, min_samples_split=2,
            min_weight_fraction_leaf=0.0, presort=False, random_state=None,
            splitter='best'),
       fit_params=None, iid=True, n_jobs=1,
       param_grid={'max_depth': [3, 5, 7, 9], 'min_samples_leaf': [1, 2, 3, 4]},
       pre_dispatch='2*n_jobs', refit=True, return_train_score=True,
       scoring='accuracy', verbose=0)
print('最优参数:', clf.best_params_)
print('验证集最高得分:', clf.best_score_)
最优参数: {'max_depth': 5, 'min_samples_leaf': 1}
验证集最高得分: 0.75
# 获取最优模型
best_model = clf.best_estimator_
print('测试集上准确率:', best_model.score(X_test, y_test))
测试集上准确率: 0.933333333333
模型评价指标
k = 7
# 转换为二分类问题
y_train_binary = y_train.copy()
y_test_binary = y_test.copy()

y_train_binary[y_train_binary != 1] = 0
y_test_binary[y_test_binary != 1] = 0

knn = KNeighborsClassifier(k)
knn.fit(X_train_scaled, y_train_binary)
y_pred = knn.predict(X_test_scaled)
from sklearn.metrics import accuracy_score, precision_score, recall_score, f1_score

# 准确率
print('准确率:{:.3f}'.format(accuracy_score(y_test_binary, y_pred)))

# 精确率
print('精确率:{:.3f}'.format(precision_score(y_test_binary, y_pred)))

# 召回率
print('召回率:{:.3f}'.format(recall_score(y_test_binary, y_pred)))

# F1值
print('F1值:{:.3f}'.format(f1_score(y_test_binary, y_pred)))
准确率:0.933
精确率:0.800
召回率:1.000
F1值:0.889
PR 曲线
from sklearn.metrics import precision_recall_curve, average_precision_score

# precision, recall, _ = precision_recall_curve(y_test, y_pred)
print('AP值:{:.3f}'.format(average_precision_score(y_test_binary, y_pred)))
AP值:0.800
ROC曲线
from sklearn.metrics import roc_auc_score, roc_curve

# fpr, tpr, _ = roc_curve(y_test, y_pred)
print('AUC值:{:.3f}'.format(roc_auc_score(y_test_binary, y_pred)))
AUC值:0.955
混淆矩阵
from sklearn.metrics import confusion_matrix

y_pred = svm_model.predict(X_test_scaled)
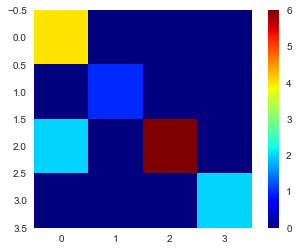
cm = confusion_matrix(y_test, y_pred)
print(cm)
[[4 0 0 0]
 [0 1 0 0]
 [2 0 6 0]
 [0 0 0 2]]
plt.figure()
plt.grid(False)
plt.imshow(cm, cmap='jet')
plt.colorbar()
<matplotlib.colorbar.Colorbar at 0xfb83668>
