tynbl.github.io
Python机器学习库scikit-learn
import numpy as np
import matplotlib.pyplot as plt
import pandas as pd
import seaborn as sns
from sklearn.model_selection import train_test_split

# 用于在jupyter中进行绘图
%matplotlib inline
水果识别
1. 数据加载
# 加载数据集
fruits_df = pd.read_table('fruit_data_with_colors.txt')
fruits_df.head()
| fruit_label | fruit_name | fruit_subtype | mass | width | height | color_score | |
|---|---|---|---|---|---|---|---|
| 0 | 1 | apple | granny_smith | 192 | 8.4 | 7.3 | 0.55 |
| 1 | 1 | apple | granny_smith | 180 | 8.0 | 6.8 | 0.59 |
| 2 | 1 | apple | granny_smith | 176 | 7.4 | 7.2 | 0.60 |
| 3 | 2 | mandarin | mandarin | 86 | 6.2 | 4.7 | 0.80 |
| 4 | 2 | mandarin | mandarin | 84 | 6.0 | 4.6 | 0.79 |
print('样本个数:', len(fruits_df))
样本个数: 59
# 创建目标标签和名称的字典
fruit_name_dict = dict(zip(fruits_df['fruit_label'], fruits_df['fruit_name']))
print(fruit_name_dict)
{1: 'apple', 2: 'mandarin', 3: 'orange', 4: 'lemon'}
# 划分数据集
X = fruits_df[['mass', 'width', 'height', 'color_score']]
y = fruits_df['fruit_label']

X_train, X_test, y_train, y_test = train_test_split(X, y, test_size=1/4, random_state=0)
print('数据集样本数:{},训练集样本数:{},测试集样本数:{}'.format(len(X), len(X_train), len(X_test)))
数据集样本数:59,训练集样本数:44,测试集样本数:15
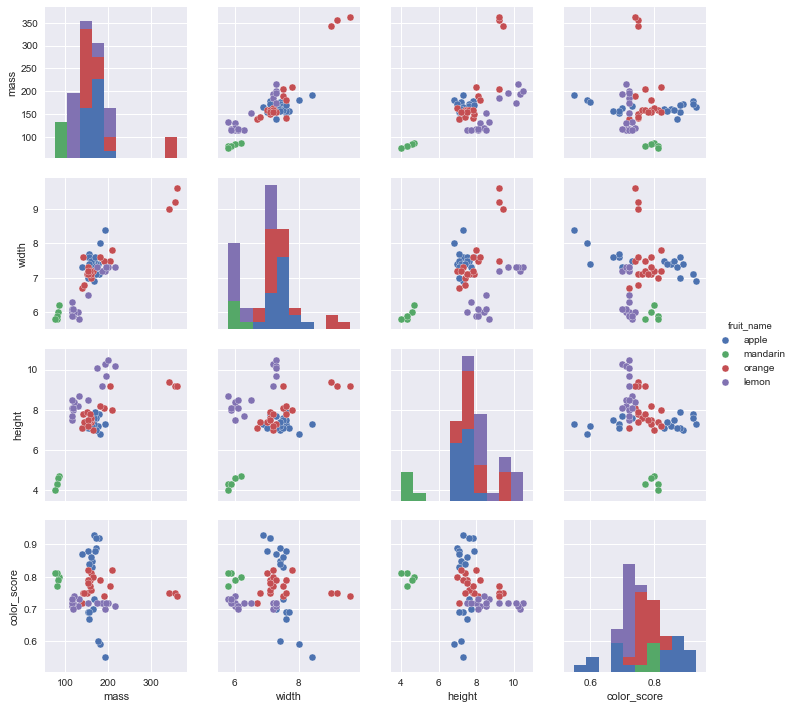
2. 可视化查看特征变量
# 查看数据集
sns.pairplot(data=fruits_df, hue='fruit_name', vars=['mass', 'width', 'height', 'color_score'])
<seaborn.axisgrid.PairGrid at 0x4b432080>

%matplotlib notebook
from mpl_toolkits.mplot3d import Axes3D

label_color_dict = {1: 'red', 2: 'green', 3: 'blue', 4: 'yellow'}
colors = list(map(lambda label: label_color_dict[label], y_train))

fig = plt.figure()
ax = fig.add_subplot(111, projection='3d')
ax.scatter(X_train['width'], X_train['height'], X_train['color_score'], c=colors, marker='o', s=100)
ax.set_xlabel('width')
ax.set_ylabel('height')
ax.set_zlabel('color_score')
plt.show()
<IPython.core.display.Javascript object>
3. 建立/选择模型
from sklearn.neighbors import KNeighborsClassifier

knn = KNeighborsClassifier(n_neighbors=5)
4. 训练模型
knn.fit(X_train, y_train)
KNeighborsClassifier(algorithm='auto', leaf_size=30, metric='minkowski',
           metric_params=None, n_jobs=1, n_neighbors=5, p=2,
           weights='uniform')
5. 测试模型
y_pred = knn.predict(X_test)
print(y_pred)
[3 1 4 4 1 1 3 3 1 4 2 1 3 1 4]
from sklearn.metrics import accuracy_score

acc = accuracy_score(y_test, y_pred)
print('准确率:', acc)
准确率: 0.533333333333
6. 查看k值对结果的影响
k_range = range(1, 20)
acc_scores = []

for k in k_range:
    knn = KNeighborsClassifier(n_neighbors=k)
    knn.fit(X_train, y_train)
    acc_scores.append(knn.score(X_test, y_test))

plt.figure()
plt.xlabel('k')
plt.ylabel('accuracy')
plt.scatter(k_range, acc_scores)
plt.xticks([0, 5, 10, 15, 20])
<IPython.core.display.Javascript object>
([<matplotlib.axis.XTick at 0x4cc50978>,
  <matplotlib.axis.XTick at 0x4cc60b38>,
  <matplotlib.axis.XTick at 0x4cc59748>,
  <matplotlib.axis.XTick at 0x4cca24a8>,
  <matplotlib.axis.XTick at 0x4cca2f60>],
 <a list of 5 Text xticklabel objects>)
# 只查看width和height两列特征
from ml_visualization import plot_fruit_knn

plot_fruit_knn(X_train, y_train, 1)
plot_fruit_knn(X_train, y_train, 5)
plot_fruit_knn(X_train, y_train, 10)
<IPython.core.display.Javascript object>
<IPython.core.display.Javascript object>
<IPython.core.display.Javascript object>